Inventory of New Single-Family Homes Jumps, Prices Drop to Lowest since 2021, Sales Sag
Inventory of new single-family homes rises as prices drop to lowest since 2021 and sales decline, according to latest Census Bureau data.
The supply of new single-family homes available for purchase increased across all regions of the United States in July, nearing record levels in the South and hitting the highest point since 2008 in the Midwest, according to data released today by the Census Bureau.
The median price of new single-family homes sold in July was $393,800, a 1% decrease from the same month last year and an 8.2% drop from two years ago. This figure represents the lowest price point since September 2021, following a 14% decline from the peak observed in October 2022. The three-month average median price, which smooths out monthly fluctuations, fell by 1.5% year-over-year and 7.2% from two years ago, reaching $404,400, also the lowest since October 2021.
These prices reflect the figures written into sales contracts and do not account for incentives or mortgage-rate buydowns that homebuilders often provide to boost sales. These additional costs are included in the average selling prices reported in builders' financial statements but are not reflected in the Census Bureau data.
In response to the current market conditions, major homebuilders have implemented strategies such as reducing price points, offering incentives, and purchasing mortgage rates to maintain revenue and market share. These efforts have significantly reduced their gross margins, impacted net profits, and contributed to declines in share prices. Shares of DR Horton and Lennar, the two largest homebuilders, have fallen by 25% and 52% respectively since mid-September 2024.
Sales of new single-family homes across all stages of construction decreased by 5.7% year-over-year in July, totaling 55,000 homes. Compared to July 2019, sales were down by 9%. The three-month average sales also declined by 0.6% from the previous year, marking the seventh consecutive month of year-over-year decreases.
The majority of sales, 91%, occurred in the South and West regions. Inventory of single-family homes at all stages of construction rose to 495,000, the fourth consecutive month of month-to-month increases. Compared to July 2019, inventory has surged by 71%.
Regionally, 61% of the inventory was located in the South, which also accounted for 63% of sales, while 21% was in the West, responsible for 28% of sales. The current inventory levels represent approximately 9.6 months of supply at the present sales rate.
Inventory of under-construction homes dipped to 262,000, a 10% decrease from last year, partly due to homes being completed and moved into the category of completed homes for sale, which increased. Compared to July 2019, under-construction inventory was up by 32%.
Inventory of completed homes for sale rose to 114,000, representing a 50% increase from July 2019 and a 170% surge from July 2022. Builders have a significant amount of capital invested in these move-in ready "spec homes" and are highly motivated to sell them.
In the South, inventory for sale reached 301,000 homes, a 73% increase from July 2019 but a 4% decrease from the all-time record set last July. Sales in the region fell by 6% year-over-year and 9% from 2019, leaving homebuilders with nearly 10 months' supply.
The West saw inventory rise to 103,000 homes, an 18% increase from July 2019 but a 6% decrease from last year. Sales remained unchanged year-over-year but were down 15% from 2019, resulting in a 9.4 months' supply.
In the Midwest, inventory for sale jumped by 18% year-over-year and 60% from July 2019 to 59,000 homes, the highest level since 2008. Sales dropped to approximately 4,000, a 50% decline from the previous year, and supply increased to nearly 15 months.
The Northeast, where multifamily construction plays a larger role, saw a 3% year-over-year increase and a 14% rise from 2019 in inventory, reaching 33,000 homes.
Comments (0)
No comments yet — be the first to weigh in.

Free School Uniform Swap Shop Saves Welsh Families £50m Annually
A Cardiff father's school uniform swap shop initiative has grown to 200 schools, helping Welsh families save £50m yearly while promoting sustainability and reducing clothing waste.

Poland, US Explore Permanent Military Bases: Defense Talks Underway
Poland and the US are discussing permanent American military bases in Poland, focusing on defense capabilities rather than troop numbers. Nuclear warheads are not part of the plans.

Taxpayers Lost $65B to Obamacare Fraud in 2024; Feds Crack Down
A Paragon Health Institute report reveals $65 billion in taxpayer losses due to Obamacare and Medicaid fraud in 2024, with improper enrollments rising in 2025.
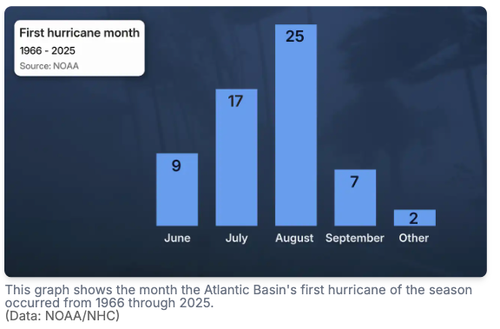
El Niño Delaying 2026 Atlantic Hurricane Season as Dolly Nears Florida
El Niño's wind shear suppresses 2026 Atlantic hurricane activity, delaying first hurricane as Tropical Storm Dolly's remnants approach Florida and the Caribbean.

Mumbai’s Vile Parle Cypher is giving unheard rappers a voice

Enrich and Ultimo impress

Karnataka CM Signals Review of 5% Park Land Amendment Bill in Assembly

